# Spots on the Sun and worn-out clothes
Have you seen the latest XKCD? It imagines a world where the Sun gets completely covered with dark spots, as opposed to only partially:
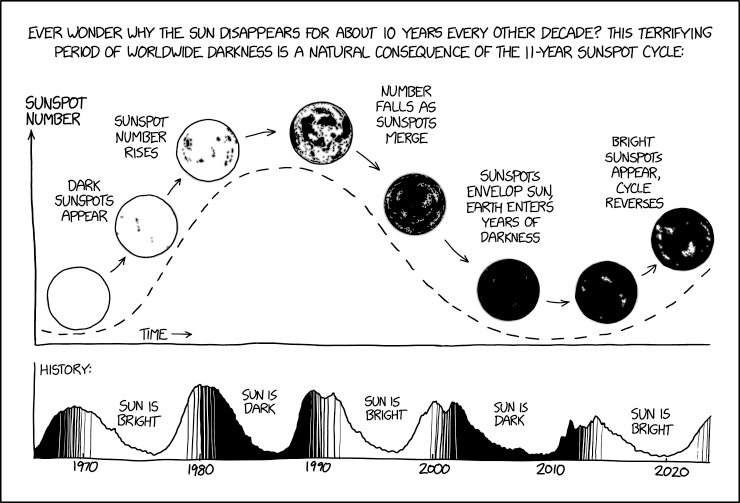
Can you see the surprising observation? The more black you add, the more spots you have. Until a certain point, where adding more black causes spots to merge. If this problem sounds remote, imagine a shirt. It starts out with 4 holes, but as it accumulates tears, it gains extra holes. Keep wearing it, and the holes will grow in size, eventually merging, until your shirt will be as good as new! At least when it comes to the number – but not the size – of holes.

But xkcd's plots didn't look quite right. Why is the sunspot number sinusoidal? And will it really get seriously dark while there's more than one spot?
I can't answer the first question definitively, as I don't know what model the author chose for darkness emerging. But I can check my own guess: if spots appear randomly and uniformly, as if a child ripped holes in your shirt deliberately, then I expect a sharp rise at first (unlike xkcd), then a slow incline until peak spots, and finally a slower decline… I guess. Like this:

But xkcd is explicit about the number of spots everywhere, so the second question is possible to answer definitively. Why do I think Sun wouldn't get so dark unless there's only one spot? It's because there's plenty of space for bright areas even with a couple big spots. When you add extra dark areas, it's going to be hard to keep them separated.

Okay, but how do I intend to test it? I don't have a miniature Sun, after all. If you're guessing that I'm going to use up my shirt supply for science, I'm also going to disappoint you. Of course, I'm using a simulation (code at the bottom).
The simulation makes some assumptions. First, we're poking white holes in a black canvas. The canvas is square and flat. Each poke leaves a white plus-shaped mark containing 5 pixels.
## Experimentation
So I ran the simulation on a couple canvas sizes, gathered the number of pokes to reach perfect black, and watched the brightness as the peak was reached and crossed.
That's what I gathered:

Looks different, doesn't it? The most striking is that the number of spots falls to 1 and remains there for the majority of the cycle. It's not sinusoidal at all. That's easy to explain: it's hard to hit a solid piece when there are only holes remaining, and my model doesn't try to be smart about it. It usually takes 9000 pokes to cover the entire picture, whereas a single hole emerges before the 3000 mark.
But that doesn't mean that it's always completely dark, either. As I predicted, reaching a single sunspot is not enough to put out the Sun. The grayness on the lower plot doesn't succumb to complete darkness immediately. But it's hard to see, so I prepared another plot:

On this plot, we still have about 1/3 brightness when a single superspot takes over. That's not what xkcd expected! Another interesting thing is that we hit peak spots before dropping to 50% brightness.
Here's my methodology for the charts:
I don't have a firm opinion on how to model the disappearance of spots, so I just mirrored their appearance in the plots. I also assumed that spot sizes are uniform, and fudged the average spot size to be 1/10_000 of the whole (after looking at figure 4 in On the size distribution of sunspot groups in the Greenwich sunspot record 1874–1976), giving a canvas 70px in size for a 5px spot.
Late nights bring weird ideas.
## Simulation code
To run the simulation on a 40x40 pixels canvas, use `python3 holes.py 40`. This is `holes.py`:
```
#!/usr/bin/env python3
# how many holes?

import cv2
import numpy as np
import itertools
import random
import sys

rand = random.randrange

w= int(sys.argv[1])
h=w

image=np.zeros((h,w,1),np.uint8)

try:
    for i in itertools.count():
        cv2.circle(image, (rand(0, w), rand(0, h)), radius=1, color=(255), thickness=-1)
        contours, hierarchy = cv2.findContours(image, cv2.RETR_TREE, cv2.CHAIN_APPROX_NONE)

        if i % 10 == 0:
            cv2.imwrite('out_{}.png'.format(i), (255 - image))

        spots = [0 for c in contours if cv2.contourArea(c,True) < 0]
        whites = cv2.countNonZero(image)
        print(', '.join(map(str, [i, len(spots), whites])))
        if i > 100 and len(contours) == 1:
            break

except KeyboardInterrupt:
    cv2.imwrite('out.png', image)
```